



PRODUCT DESIGN / ENGINEERING / AI
A note on confidentiality. Client data, internal workflows and additional use cases are not shown, in accordance with NDA commitments and GDPR data-protection obligations. The conceptual illustrations below explain the product’s logic without exposing confidential information; they are not production screens or client results.
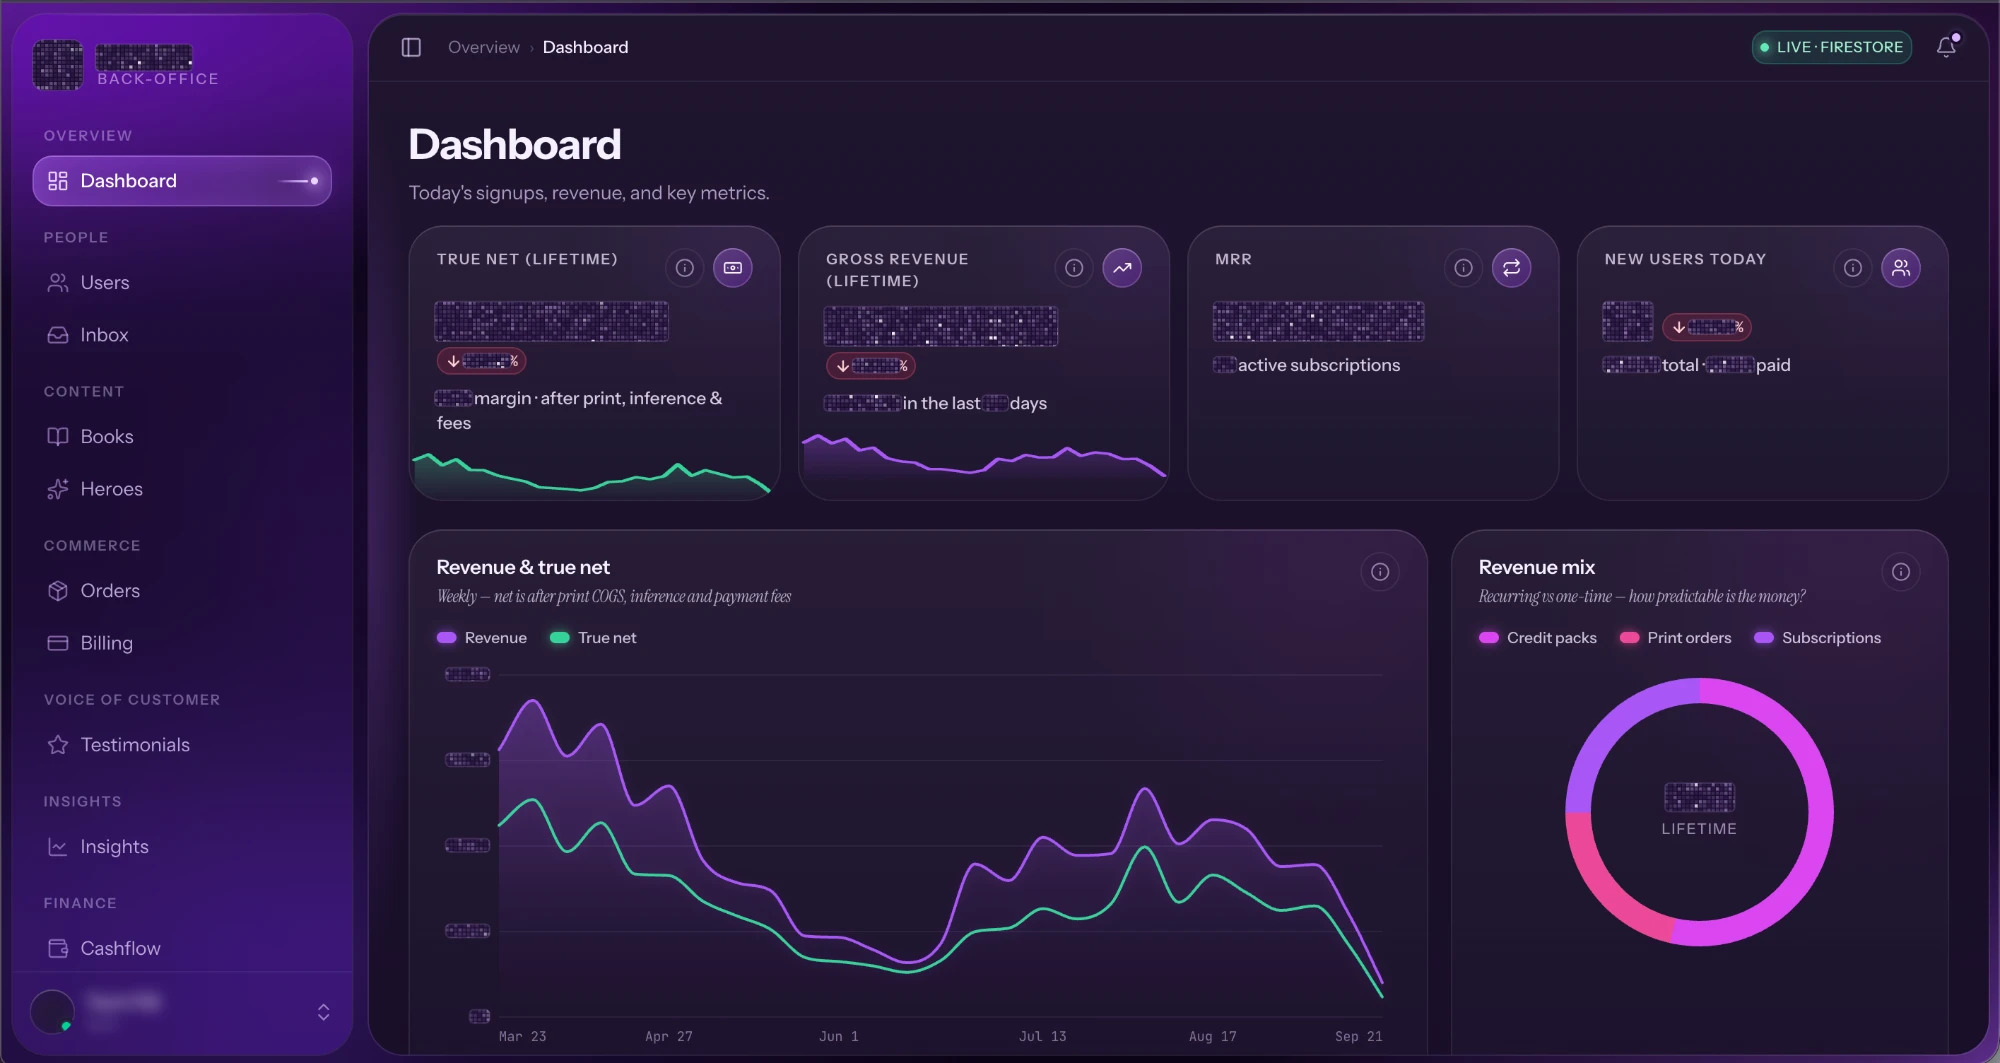
The bank says one thing. The ad platform says another. Operations has a third version. Back Office replaces that reconciliation loop with one shared picture of the business.
My role: everything from product strategy and UX to data architecture, integrations, AI and deployment. Designed, built and shipped into daily use.
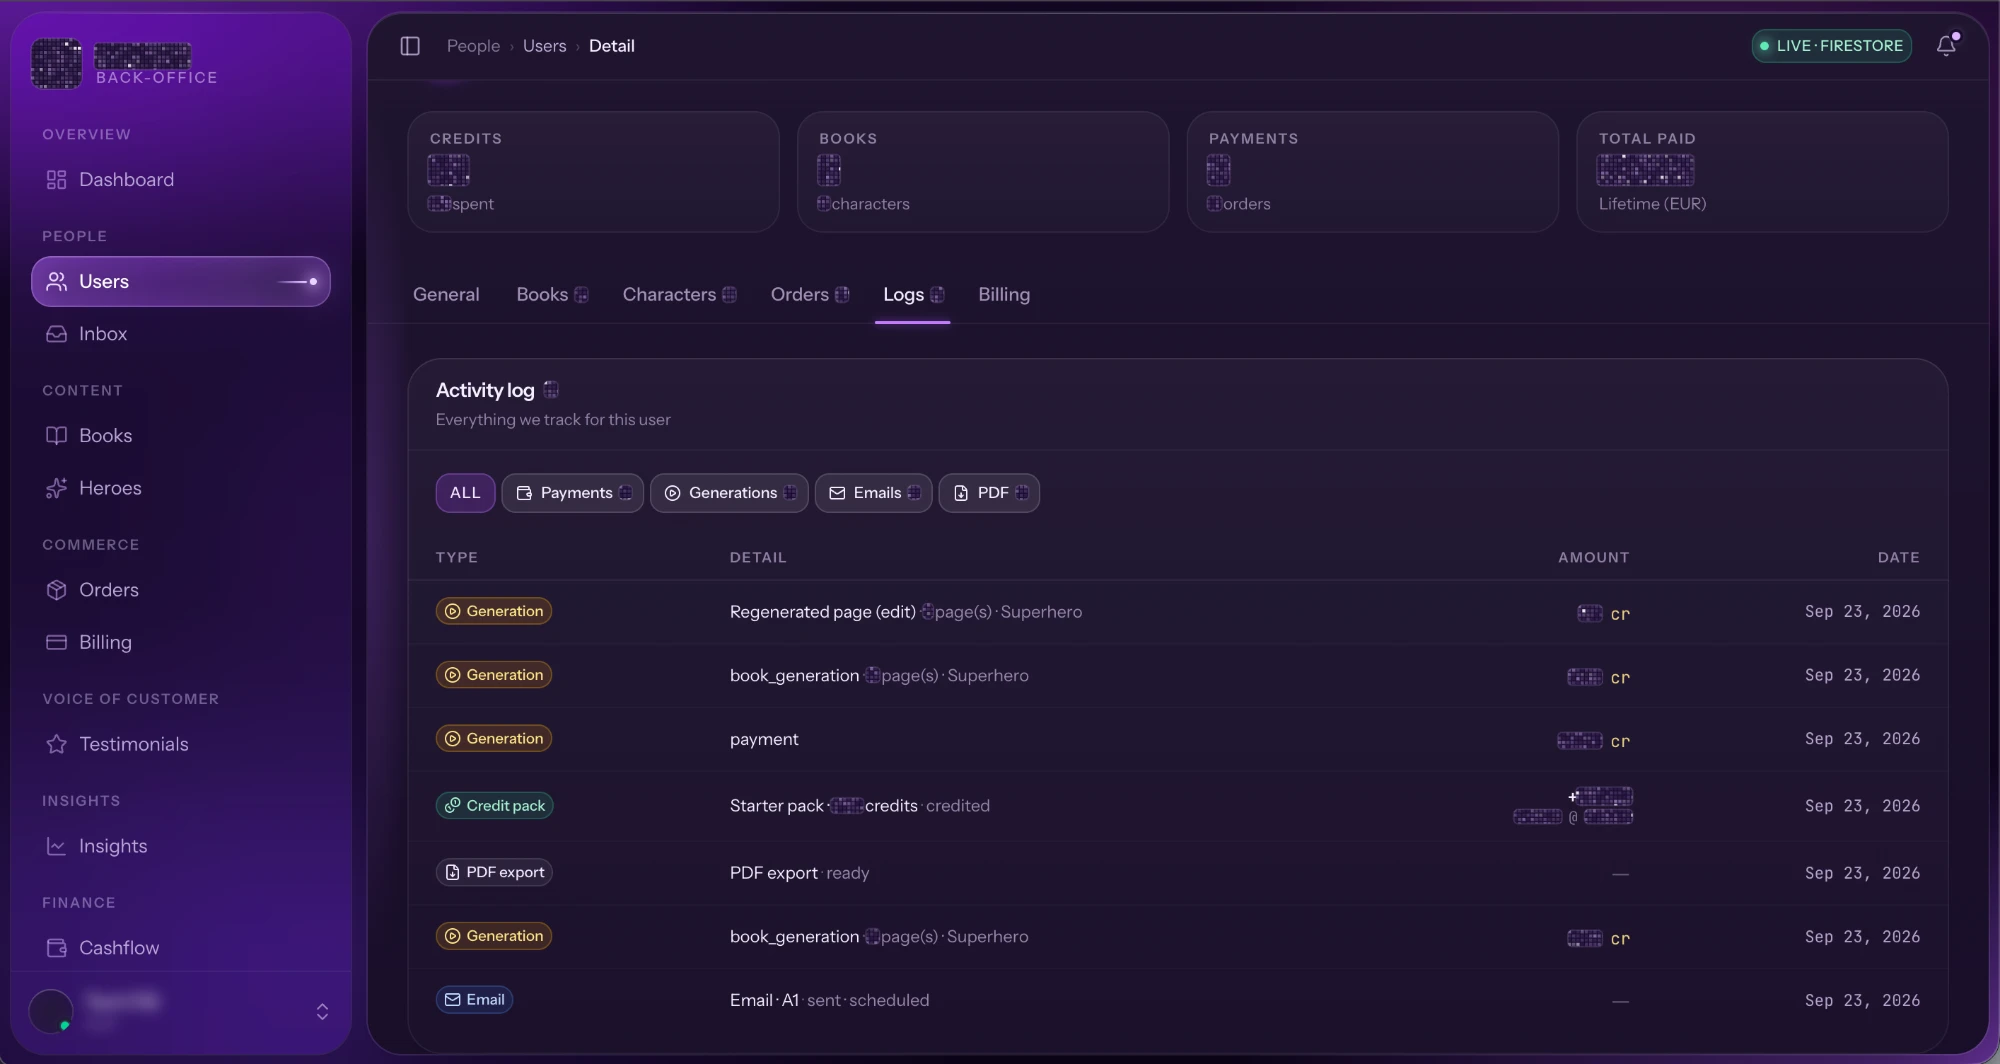
Orders, subscriptions, refunds and support live together. Open a detail panel without losing your place in the list.
OPERATIONS / CONCEPTUAL INTERACTION
Other orders remain visible while you inspect the detail.
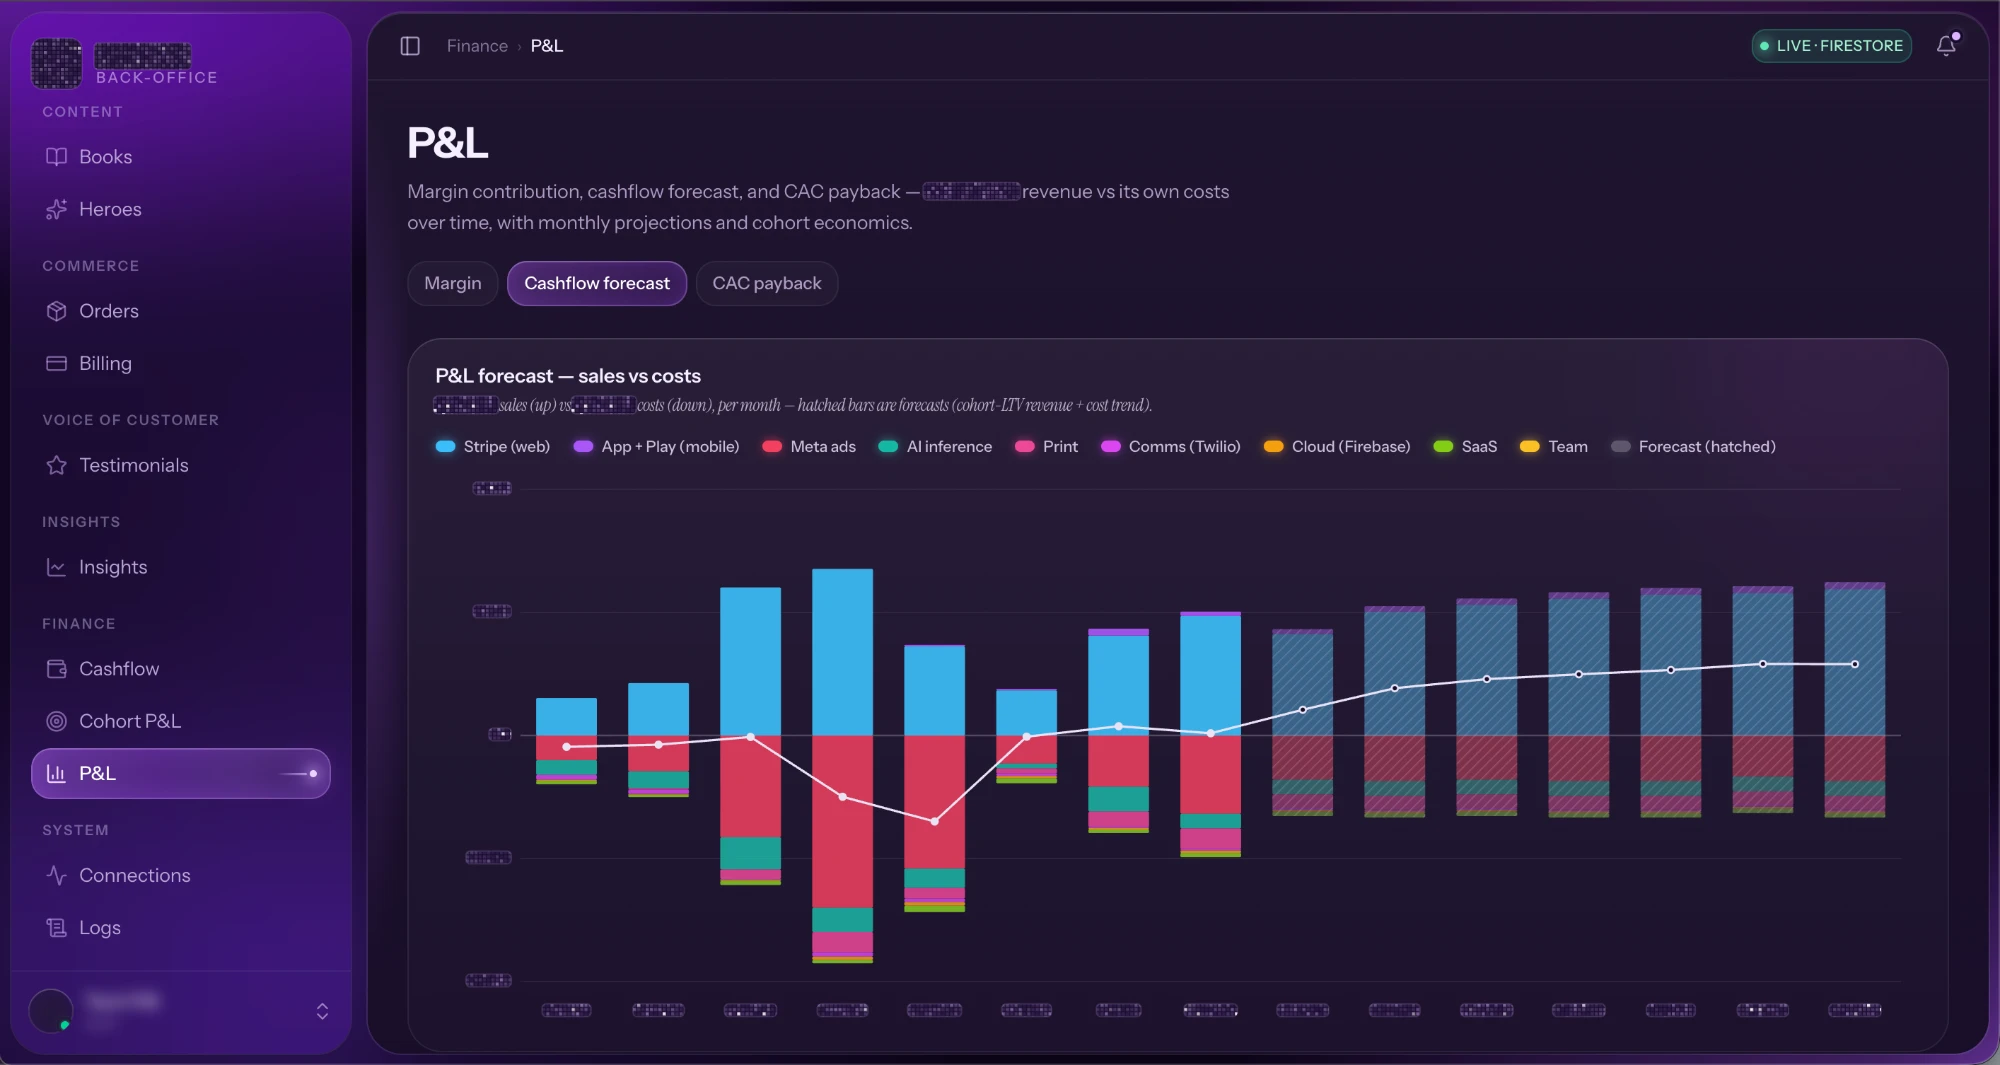
Cash, not guesswork.
Bank-reconciled cashflow, vendor spend and forecasts grounded in real revenue and costs.
Revenue
Costs
FEB
MAR
APR
MAY
JUN
JUL
AUG
SEP
REVENUE / COSTS · SCHEMATIC, NOT CLIENT DATA
Did acquisition pay back?
Follow each cohort from acquisition cost to realised return. Judge spend by what it earned, not what a platform claimed.
Returned
Outstanding
Break-even
M1
M2
M3
M4
M5
M6
M7
M8
ACQUISITION TO PAYBACK · ILLUSTRATIVE ONLY
One event feed makes failed jobs, stuck workflows and funnel drops visible before customers notice.
Event feed / conceptual, not live telemetry
Jobs
Workflows
Funnel
Anomaly surfaced
First customer complaint
Connect once. Share the context.
The MCP layer brings existing tools into the same metric definitions and AI context. No new silo for every integration.

Payments
Banking
Advertising
MCP
One shared context
Trusted metrics
One event feed
AI that knows why

Slack · #finance
lena
September margin looks off against the bank statement.
didier
Print COGS moved, but I can’t tell how much of it is refunds.
@BackOffice why did margin drop?
Back Office · Assistant
Why did margin drop in September?
Worked for 8 sec · revenue, refunds, vendor costs
Margin fell 4.2 points. Print COGS rose faster than revenue; refunds held flat.
Print COGS
+18.4%
Refunds
+0.3%
AI inference
−2.1%

Cursor
fix the per-transaction FX rounding flagged by Back Office
Pulled metric definition over MCP
finance/normalise.ts
+14 −6
Ask a question, investigate an anomaly or draft a reply. Company data supplies the context; team feedback sharpens the next answer.
ILLUSTRATIVE EXCHANGE / NOT LIVE AI
01
Check revenue, refunds and vendor costs.
02
Trace the change back to its source.
03
Refine the answer with the team’s feedback.
Your business. Your workspace.
Switch on the modules you need. Shape the metrics, workflows and views around how your team actually operates.
FIG 0.7
METRIC TRANSPARENCY / SYNTHETIC EXAMPLE
32%
Contribution margin. A number you can question.
FIG 0.1
One number. One definition.
Compute each metric once, on the server. Make its formula and source inspectable. Trust comes from being able to check.
FIG 0.2
Data arrives ready.
Server Components query and cache each source. Complex views load without browser-side request chains.
FIG 0.3
Convert first. Then add.
Normalise currency per transaction, not after aggregation. Margin stays reconcilable with the bank.
FIG 0.4
Compare the same customer age.
Month three should mean month three, whether a customer joined in January or March.
FIG 0.5
The question shapes the chart.
Typed SVG makes room for payback curves, diverging bars and hatched forecasts, without fighting library defaults.
FIG 0.6
Density without the noise.
Aligned numerals make data scannable. Clear heading contrast, contextual panels and collapsible groups keep detail within reach.
FIG 0.8 — Architecture
EXPLORE ANOTHER PROJECT
